Bridging the Git-to-Jira Gap: How Generative AI Finally Unifies Your Engineering Data
Stop manually matching GitHub PRs to Jira tickets in Excel. See how Keypup's AI Agent instantly translates business goals into technical execution metrics.
Optimize engineering velocity with Keypup's AI. Move beyond raw metrics to contextual insights, diagnose SDLC bottlenecks, and accelerate software development.

Every engineering leader strives for faster, more efficient software delivery. But what does 'velocity' truly mean, and how do you achieve it without sacrificing quality or burning out your team? This article delves into how to move beyond superficial metrics and leverage AI to truly optimize engineering velocity, transforming it from a mere speed indicator into a powerful lever for strategic growth. We'll explore why traditional metrics often fail, what factors genuinely drive software delivery performance, and how Keypup's autonomous engineering intelligence platform provides the contextual engineering metrics needed for real, sustainable improvement and SDLC optimization.
In the pursuit of speed, many organizations fall into the trap of relying on simplistic, raw engineering velocity metrics. Whether it's story points, lines of code, or even basic throughput numbers, these metrics rarely tell the full story. They ignore crucial factors like project complexity, the impact of technical debt, unplanned work, or the health of collaboration. This leads to what we call the 'velocity paradox': the harder you try to optimize based on incomplete data, the more likely you are to create perverse incentives, foster 'gaming the system,' and ultimately misdiagnose the real challenges to your software delivery performance. Understanding these common agile velocity pitfalls is the first step toward true optimization. As one frustrated engineer put it:
"Our scrum master just announced a new goal: 'Increase story points per sprint by 20%.' Now everyone's just padding estimates or splitting stories into tiny chunks. The number goes up, but we're not actually delivering more value. It feels like we're just gaming the system, not improving our actual engineering velocity."
To genuinely optimize engineering velocity, we must look beyond basic outputs and consider the underlying drivers of software delivery performance. This means focusing on a holistic view of the SDLC. Key factors include: efficient cycle time metrics (broken down by stages like coding, review, and deployment), effective management of lead time for changes, minimizing the impact of unplanned work (like bug fixes or urgent support), proactive technical debt management, and fostering healthy team collaboration. These elements, often captured by comprehensive DevOps metrics like DORA metrics, provide the contextual engineering metrics necessary to understand not just 'what happened,' but 'why' and 'how to improve it.' Merely plotting these metrics on a dashboard, however, isn't enough – you need to bridge the Git-to-Jira gap with intelligence to gain actionable engineering insights.
Traditional analytics tools and even internal DIY dashboards often fall short, providing raw data without the critical context needed for actionable engineering insights. This is where Keypup's autonomous NLP engineering intelligence platform transforms the game. By connecting granular data from GitHub, GitLab, Jira, and other tools, and layering it with generative AI, Keypup moves beyond simply reporting metrics. It understands the nuances of your SDLC, identifies root causes of bottlenecks, and provides prescriptive analytics. This shift empowers teams to diagnose issues like 'why is our cycle time up?' and receive specific recommendations on 'how to fix it,' empowering leaders to make data-driven decisions that genuinely accelerate software development without resorting to micromanagement. As a recent Reddit post highlights:
"Management had us spend three weeks building an internal dashboard to track our DORA metrics via GitHub and Jira APIs. Now, every time Lead Time for Changes goes up, there's a panic. The dashboard tells us we're slower, but it doesn't tell us why. It’s just noise, and I still have to spend two hours manually digging through pull requests to figure out who or what caused the bottleneck."
With Keypup's AI Agent, you can instantly generate sophisticated dashboards and analyses using plain English prompts, moving from reactive reporting to proactive problem-solving. This approach empowers you to pinpoint specific areas for SDLC optimization, improve engineering efficiency, and ensure your team is always moving in the right direction to improve team velocity metrics. Here's how you can leverage Keypup to get answers and drive improvement:
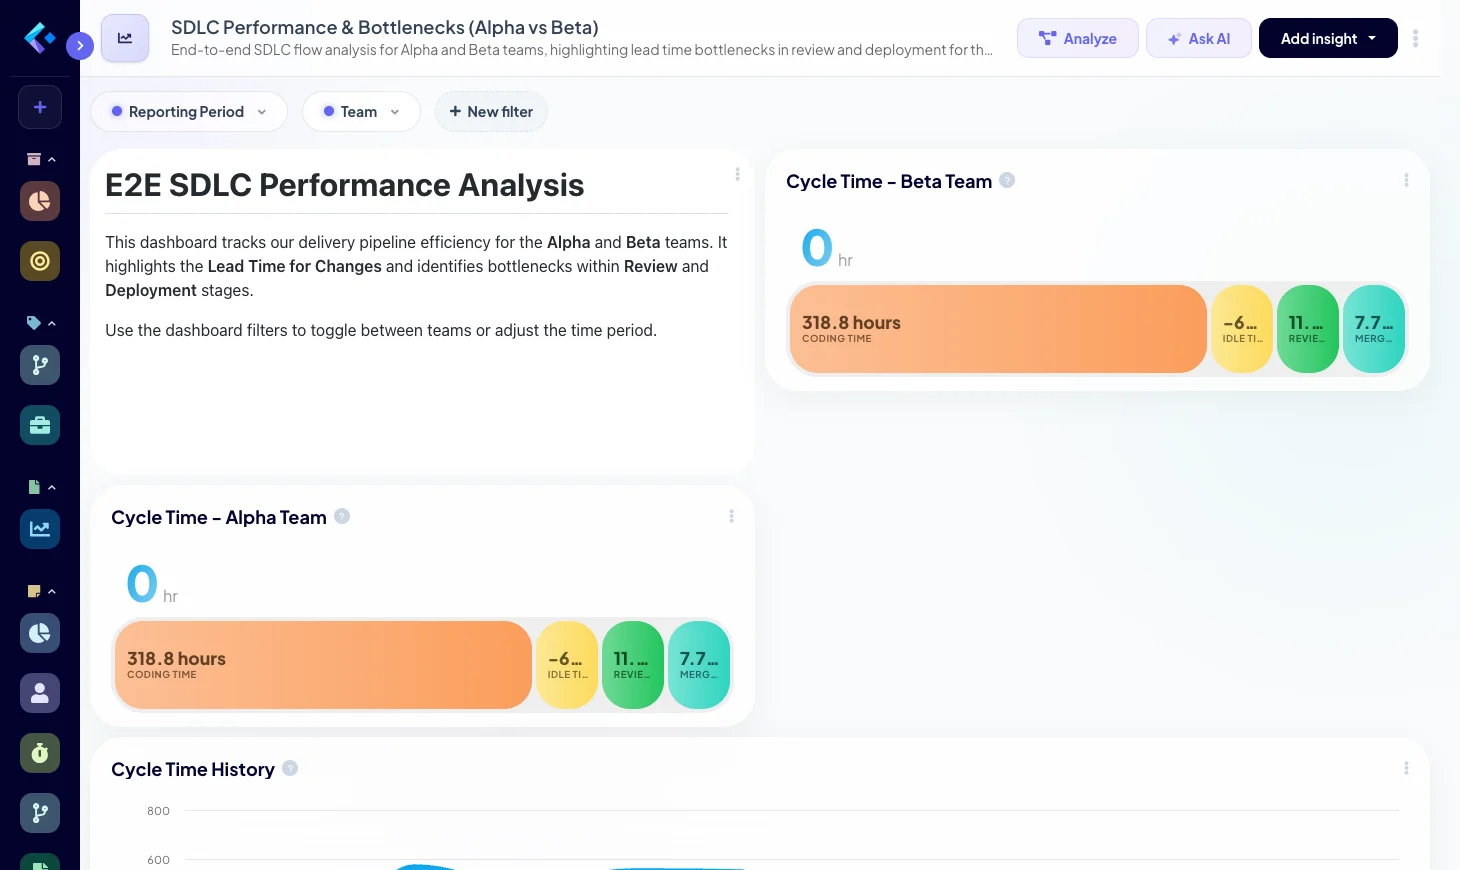
Create a dashboard showing our end-to-end SDLC flow, highlighting bottlenecks in lead time for changes, especially focusing on review and deployment stages, for the last quarter. Compare performance across our 'Alpha' and 'Beta' teams.
Teams often know they're delivering slowly but don't know where or why the slowdowns occur. This prompt helps pinpoint specific stages or teams that are consistently becoming bottlenecks, allowing for targeted intervention rather than broad, ineffective changes. It's key for engineering velocity optimization.
Analysis from Keypup AI
Key Insights 📊 The AI analysis visualizes a clear breakdown of cycle time by stage (e.g., coding, PR review, QA, deployment) for both 'Alpha' and 'Beta' teams over the last quarter. It immediately highlights that the 'Review' stage for the 'Alpha' team has an average duration 40% higher than 'Beta', significantly impacting their lead time for changes. Deployment for 'Beta' also shows spikes in duration.
⚠️ Bottlenecks and Problem Areas For the 'Alpha' team, the primary bottleneck is the PR Review stage, often experiencing delays due to inconsistent reviewer availability and high context-switching for designated reviewers. For 'Beta', sporadic spikes in deployment time indicate potential issues with specific CI/CD pipeline steps or environment instability, leading to increased mean time to restore.
💡 Recommendations Focus on streamlining the PR review process for 'Alpha' and improving deployment reliability for 'Beta'. These targeted improvements will directly impact overall development throughput and improve engineering efficiency.
🚀 Priority Actions
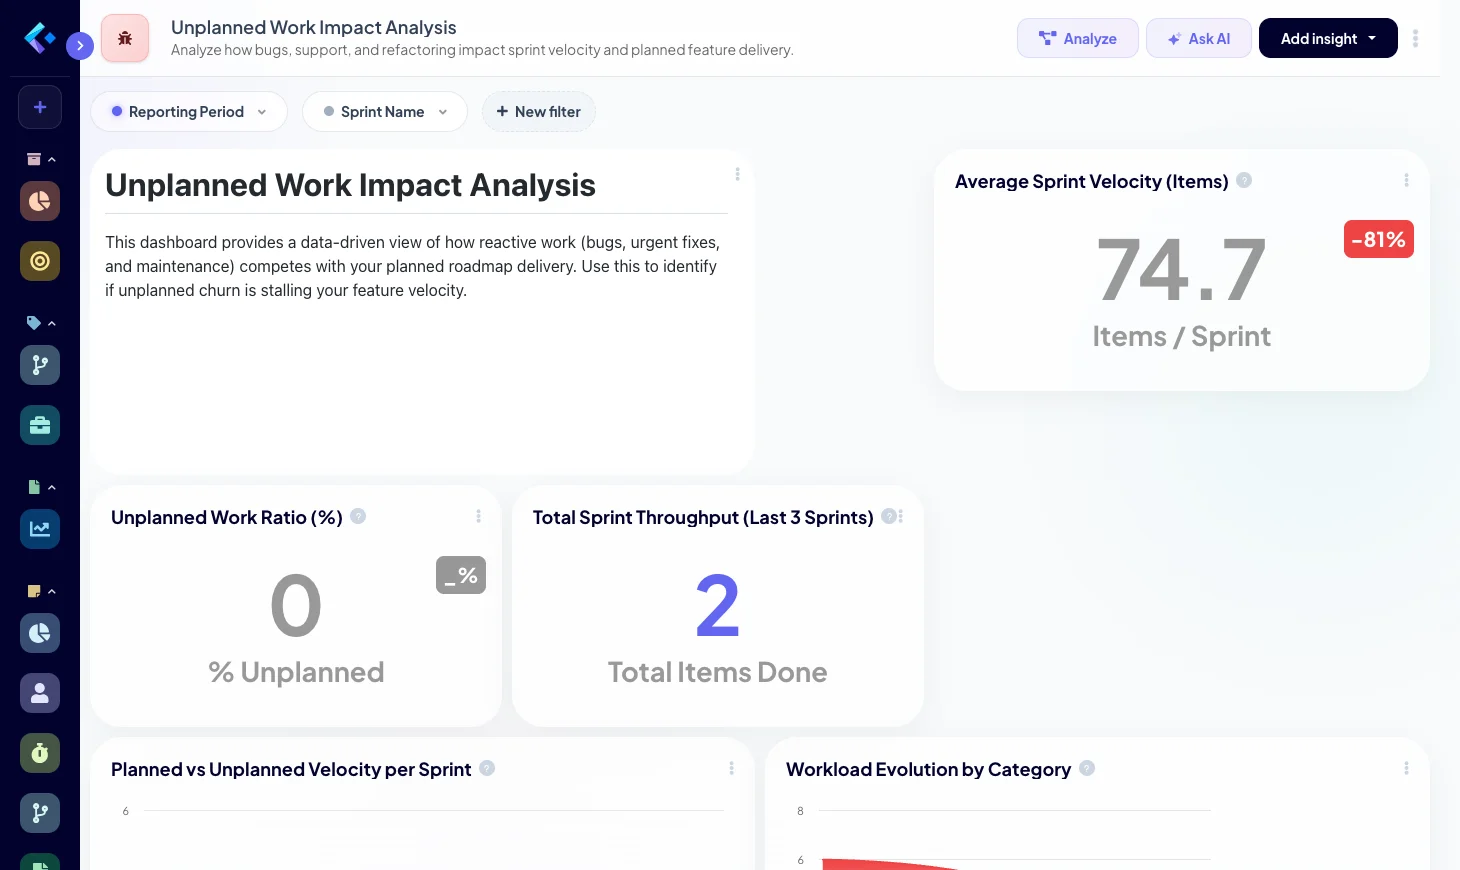
Generate a dashboard to analyze the impact of unplanned work (bugs, urgent fixes, support tickets, refactoring) on our sprint velocity and planned feature delivery for the last 3 sprints. Show how it correlates with the overall development throughput.
Unplanned work is a silent killer of engineering velocity. Developers often feel overwhelmed by context switching and interruptions, which directly impacts their ability to deliver on sprint commitments and planned features. This prompt quantifies the cost of this 'invisible work' and provides data to advocate for dedicated time for planned work and systemic improvements to enhance software delivery performance.
Analysis from Keypup AI
Key Insights 📊 The AI analysis clearly presents a visualization of work types within sprints, demonstrating that across the last 3 sprints, an average of 35% of engineering capacity was consumed by unplanned work. There's a strong inverse correlation: sprints with higher percentages of unplanned work consistently show lower sprint completion rates for planned features and reduced overall development throughput.
⚠️ Bottlenecks and Problem Areas A significant portion of unplanned work originates from high-priority bug fixes related to the 'Customer Authentication' module, indicating an area of technical debt or insufficient testing. Furthermore, 'Beta' team is disproportionately burdened by urgent support requests, frequently disrupting their planned feature development.
💡 Recommendations Strategically reduce the volume of unplanned work to free up capacity for planned features. This will directly improve engineering efficiency and accelerate software development by reducing context switching and increasing focus.
🚀 Priority Actions
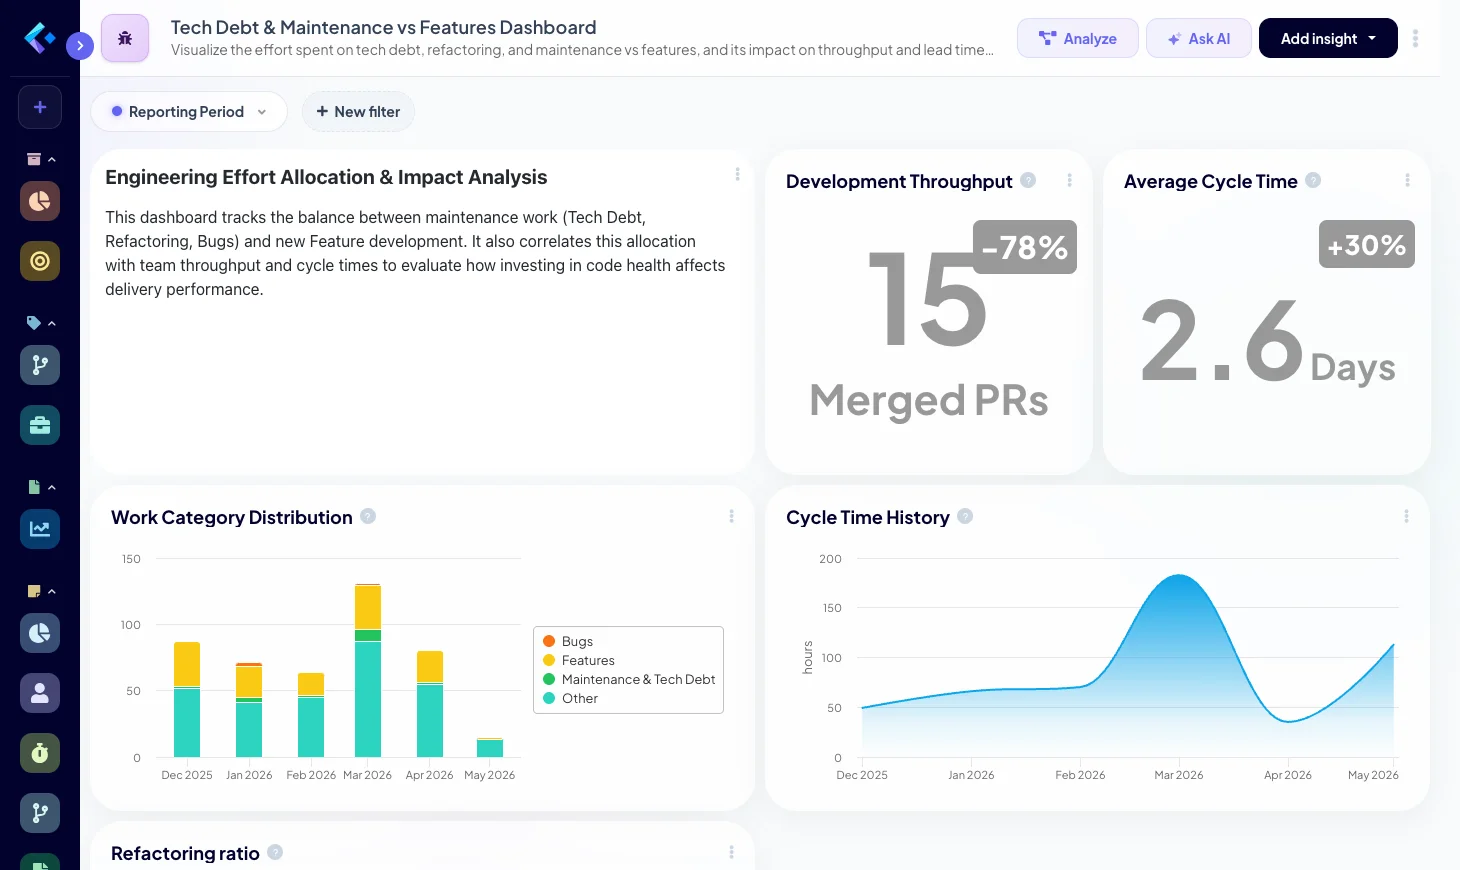
Provide a dashboard that visualizes the effort spent on technical debt reduction, refactoring, and maintenance tasks versus new feature development over the last 6 months. Analyze its impact on our overall development throughput and lead time.
Technical debt is a critical but often unquantified drain on engineering velocity. Teams understand its presence but struggle to articulate its measurable impact on software delivery performance or to justify dedicated resources to address it. This prompt provides the data to show how investing in technical health directly correlates with improved velocity and accelerated software development.
Analysis from Keypup AI
Key Insights 📊 The AI analysis visualizes that approximately 45% of engineering effort over the last 6 months has been allocated to maintenance, bug fixes, and minor refactoring, leaving only 55% for new feature development. This trend correlates with a 20% increase in average lead time for changes for new features and a 15% decrease in overall development throughput compared to the previous period where technical debt effort was lower.
⚠️ Bottlenecks and Problem Areas The 'Legacy Reporting Service' is identified as a major source of technical debt, accounting for 60% of maintenance tasks and significantly increasing the complexity and review time for any new features interacting with it. Deferred refactoring in this area is a direct drag on current engineering velocity.
💡 Recommendations Proactively address significant technical debt in identified areas to unblock new feature development and improve long-term engineering velocity. Strategic investment now will prevent future slowdowns.
🚀 Priority Actions
Engineering velocity broadly refers to the rate at which an engineering team delivers value. It's crucial because it directly impacts an organization's ability to innovate, respond to market changes, and achieve business goals. However, raw velocity metrics can be misleading without proper context, leading to poor software delivery performance.
Traditional metrics like story points or raw commit counts lack context. They don't account for project complexity, technical debt, unplanned work, team collaboration quality, or external dependencies. This absence of context can lead to misinterpretations, perverse incentives, and an inability to diagnose real performance issues, hindering engineering velocity optimization.
AI, particularly generative AI and NLP, can connect disparate data sources (Git, Jira, etc.) to provide crucial context. It moves beyond 'what happened' to 'why it happened,' diagnosing bottlenecks, identifying root causes, and prescribing actionable solutions. This shifts the focus from simple reporting to proactive, intelligent SDLC optimization, leading to better team velocity metrics.
DORA (DevOps Research and Assessment) metrics – Lead Time for Changes, Deployment Frequency, Mean Time to Restore, and Change Failure Rate – are key indicators of software delivery performance. They provide a more holistic and accurate picture of velocity than traditional metrics by focusing on the entire delivery pipeline, helping teams improve engineering efficiency and accelerate software development.
Keypup's autonomous NLP engineering intelligence platform provides a unified view of your SDLC, bridging the Git-to-Jira gap with AI. It helps you understand the true drivers of your engineering velocity, diagnose bottlenecks with prescriptive analytics, and empowers your teams to make data-driven decisions for continuous improvement without micromanagement, delivering unparalleled engineering analytics and insights.
<a href="https://hq.keypup.io/signup" target="_blank" style="display: inline-block; padding: 10px 20px; margin-top: 15px; background-color: #007bff; color: white; text-decoration: none; border-radius: 5px; font-weight: bold;">Start Optimizing Your Velocity Today!</a>
Join teams already using AI to make data-driven decisions faster than ever.
Stop manually matching GitHub PRs to Jira tickets in Excel. See how Keypup's AI Agent instantly translates business goals into technical execution metrics.
Developers hate engineering metrics because they feel like surveillance. Learn how to use Keypup's AI to shift the focus from individual micromanagement to systemic SDLC improvement.
Discover why internal DIY dashboards and basic LLM wrappers just create 'noise.' Learn how Keypup’s NLP platform goes beyond plotting metrics to actively diagnose your SDLC bottlenecks and prescribe actionable improvements.